Sunday, May 14, 2017

A Visual Representation of Square Roots

I have been working on Pythagorean Theorem, square roots, and irrational numbers with my students.  I went to my usual favorite resources and came across this representation on Andrew Stadel's Estimation 180 website in the Clothesline Math Section.  There are a couple pages of them for the clothesline. (If you are not familiar with clothesline math, it is time you get acquainted.)
Feeling both excited (because I love exploring conceptual understanding and visual representations) and confused (because I wasn't entirely sure what I was looking at), I knew I had to use these in class. I did not end up doing the clothesline activity.  What I did instead was start by showing my students a perfect square picture.  
We have used squares to discuss exponents, so my students quickly saw that this represents the square root of nine.  Square root is the inverse of squaring, therefore if you take the square root of 9 you get the side length of the square, which is 3.  After showing the perfect square picture I put up this one:
I simply asked, "If the last one was the square root of nine, what number is this the square root of?"  Every student had estimated a decimal number (Why wouldn't they? It sure looks like it won't be a whole number.)  Then I told them it was a whole number.  There were surprised and now were in the same place I was with this representation. We all needed to explore what was happening.  I told them it was 12 and let them discuss and process this information with their teams.  In the past, for numbers like the square root of 12, I would use an open square and put the answer, ~3.464, on the side of the square.  The difference with this visual is that the square is divided into unit squares. 
  • The small rectangular pieces are ~0.464 x 1 
  • The tiny square is ~0.464 x ~0.464
  • All the pieces added together equals 12.
Can we please take a minute to appreciate that?  Earlier in the school year we explored repeating decimals.  I still find it mind boggling.  1/3 is so simple to draw, yet as a decimal it repeats forever.  1/3 is a finite piece of a granola bar, but as a decimal it never ends. If you have never explored sharing that granola bar with 3 people by dividing the bar only into tenths you really should.  It will give you a whole new understanding of our base ten system and why some fractions become repeating decimals.  That exploration earlier in the year helped us understand how a decimal that does not end can so simply be represented by a small part of a square.  It is still just as mind boggling to think that those decimals which do not repeat and cannot be written as fractions, can add together to get a whole number.  And yet it does.  And that is the point of showing this visual to your students.  My depth of understanding square roots and irrational numbers increased when I analyzed this visual.  That is what I want for my students.
Students don't need to be able to look at a square like the one above and know what whole number it represents.  The purpose of the visual for the clothesline is for students to understand the relative size compared to the perfect squares and where they would fall on a number line. I will probably do the clothesline activity yet this year.

After our class discussion, I was tweeting the highlights from my week and the visual of the square root of 12 was one of them.  
There was a lot of activity on that tweet and one of them was this:

Followed by this one:


First, let me say I love my PLN.  This is why I am a part of #MTBoS.  This misconception had never occurred to me and I definitely want to go back to class and check in.  All of the squares on Andrew's clothesline are either perfect squares or irrational, which is just fine for that activity.  It is important, however, in our class discussions to have some examples with partial squares that are not irrational.  Luckily, Andrew made a Desmos activity to go along with the clothesline activity so I was able to easily create this one for the square root of 6.25. The rectangle pieces are 0.5 x 1 and the small square is 0.5 x 0.5.

To help facilitate these conversations, should you choose to have them (and for myself in the future), I put together a few starting points using some of my favorite conversation starters.  

If there are partial squares it is [always, sometimes, never] an irrational number.

I took one slide of Andrew's Desmos activity and made it its own activity so students can explore this and decide for themselves.  Students can see the area and square roots in the activity, which will help them analyze and decide.  

Notice/Wonder

You could also start with the visual representation in Desmos and simply ask, "What do you notice? What do you wonder?"  I recently discovered (thanks to Sara VanDerWerf) if you tell them to, "notice until I tell you to stop", you will have more (often better) launching points for class discussions.  You would want to modify the Desmos activity to not have the always, sometimes, never question with it.  

Which One Doesn't Belong

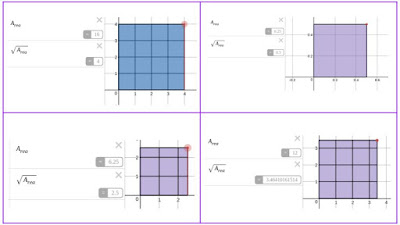
Take a minute to play it yourself before you read my notes.  These pictures were created in Andrew's Desmos activity and could easily be changed if you wanted something different.  Only one of them is an irrational number.  Can you tell which one? I also decided to add one where the square root is bigger than the area.  Wait, what?! How does that even happen?  There are so many possible discussions that could come out of this WODB I am gitty with excitement.  

I realize that there is a lot to take in here, especially if it is the first time you are seeing this visual representation.  Please feel free to leave comments below.  I would love to hear about your thoughts, questions, or any class discussions you have with this visual representation of squares and square roots.  


Thursday, May 11, 2017

My recommendation for parents who want to help their children improve their math skills:

As summer approaches I have been thinking about helping students maintain their math learning and how to best help support parents as they take over the role of math teacher for their child during the long break from school.  The challenge for me as a middle school math teacher is that the students are already counting down to when they get a break from school work.  How can I motivate students to want to continue their math journey through the summer months? More importantly, how can I convince parents that this can be done without the constant struggle and agonizing arguments that may have occurred during the school year?

The answer lies in a quote from Sara Vanderwerf. "What do mathematicians do? They notice patterns. They describe patterns; and they generalize patterns."

As parents, if we spend time with our children noticing the world around us, we can strengthen their math sense, and it will help in every area of mathematics.  Here is an example of what I am referring to.  The picture below is from a 7th grade assessment focusing on simple interest.

I don't want to go into a lesson on calculating simple interest, which the student was able to do (but with a 0.6% interest rate instead of 6%).  What I want to point out is the answer to the second question.  Do you know why the student multiplied 2,400 by 5?  
This is an example of what Graham Fletcher calls "Number Plucking".  I'm not sure if he coined the term, but he used it in a presentation at a conference I recently attended.  The term refers to students who take numbers from the problem and perform an operation (like multiplication) without first making sense of the information.  Graham pointed out that in lower elementary students have a 50% chance of getting it right because they are only working with addition and subtraction.  When we add multiplication and division children will be correct 25% of the time.  What does this mean for middle school and a simple interest problem like above? 

While math facts and operations are an important part your child's math learning in school, the best thing parents can do is help them to understand number relationships, patterns, and making sense of the math in the world around them.  

My Recommendation

If all of this is hitting home with you and you are wondering where you would even begin to help your child in this way, here is my recommendation. Each week I receive a newsletter from a website called Table Talk Math.  Jason Stevens, the creator of this site, is dedicated to helping parents build this sort of math thinking with their children. The free weekly newsletter has different conversation starters you can have around the dinner table (hence the name "Table Talk Math"), in the car, or wherever your summer takes you.  In addition to the website, there is a Table Talk Math book available.  

I was so excited about the ideas and potential conversations this book offers I wrote this review. 

This book is a must buy for every parent. It teaches parents how to weave math conversations into the activities we are already doing as well as provide resources and websites if I want to know more. The focus of the book is on building number sense and mathematical thinking as opposed to specific concepts so it is applicable to all age ranges and the author, Jason Stevens, explains how the different conversations can be changed depending on the age range of the child. I can see myself rereading this book every spring thinking about my children’s current skills and interests.

I found this book through following the Table Talk Math website and receiving the newsletters. It suggests great topics of conversation to have with kids based on everyday things. With summer coming up, I want to support my children’s learning and help maintain their skills. In the past I have purchased workbooks with every intention of having my kids do a few pages a day. Unfortunately this never lasts long as our summer schedule gets busy (or perhaps more relaxed) and the workbooks just collect dust. Since I was enjoying the Table Talk Math newsletters, I bought this book hoping it would give me more examples of math we could talk about over the summer. It does that and so much more.

My favorite part of the book is at the end of each chapter, there are specific tips for how to talk to my child about math. Stevens shares ways to encourage your child and how to keep the conversation positive. (Trust me there have been many not so pleasant times together during the school year trying to work on homework together.)

The Table Talk Math book is easy to read and understandable for parents, no matter what your math comfort level is. I felt like I was having my own personal conversation with the author as he shared his experiences as a child, parent, and math teacher. Plus, I really can have conversations with the author as he is very accessible on Twitter and includes a hashtag for the book to continue the conversation online.

I encourage you to check out Table Talk Math.  I would love to hear about your math conversations and experiences in the comment section below.  You can also add questions you have and I will help you in any way I can.